
Worried about candidates using AI? See our AI-resistant tests.
FREE CALCULATOR · TAKES 2 MINUTES
What does manual CV screening actually cost you?
Every application your team reads is salaried time — and AI has quietly inflated volumes while draining the signal out of each one. Put your own numbers in and get an honest annual figure for what manual screening costs, and what a test-first process would hand back.
 2 minutes
 6 inputs
 No email required
Six numbers about your hiring funnel. You'll get the annual hours and cost of manual screening, a category, and a side-by-side view of what a test-first process would save — with every assumption shown.
Takes 2 minutes
6 inputs
Assumptions shown
Your hiring funnel, in six numbers
CV, cover letter, application form
Salary plus on-costs ÷ working hours
Include prep and debrief time
£0
per year
Where the money goes
With test-first screening
Next: is your process AI-proof? Take the 2-minute AI Resistance Scorecard →
Email me this breakdown
Get your annual figures and the assumptions behind them in your inbox — ready to forward to your leadership team. No spam, ever.
✓ Thanks — your breakdown is on its way.
Something went wrong — please try again in a moment.

Trusted by Monzo, EDF, and more


Why this matters
Screening cost is invisible because it's salaried time.
Nobody invoices you for CV reading. It disappears into recruiter hours, hiring manager evenings, and "I'll get through the pile this weekend" — which is exactly why it never shows up in a budget conversation. At any real volume, manual screening quietly consumes weeks of salaried time a year, before a single interview happens.
And it's getting worse on both sides of the equation: candidates can now mass-produce polished, tailored applications with AI, so the pile grows while each application tells you less. More hours spent, on weaker information. The calculator above turns that vague sense of "a lot" into an annual figure you can actually act on.
WHERE THE COST HIDES
-
 Reading time at volume — 100 applications at five minutes each is more than a full working day. Per role.
 -
 AI-inflated application piles — candidates can mass-produce tailored applications in minutes, so volumes rise while the signal in each one falls.
 -
 Wasted interviews — weak shortlisting sends candidates who would never pass a valid ability test into your most expensive stage: live interview time.
 -
 Reviewer fatigue — nobody applies the same bar to CV number 80 as they did to CV number 8. Inconsistent shortlists cost re-runs, and sometimes mis-hires.
HOW TO CUT IT
- Test first, read second. A short, valid ability assessment ranks the entire pool before a human opens a single application.
- Review only the top slice. Reading the test-ranked top 25–30% cuts screening hours by around 70% — without lowering the bar.
- Protect interview time. Only candidates with verified ability reach the most expensive stage of your process.
- Keep the CV as context, not evidence. Use it to inform a conversation with a shortlisted candidate — not to rank a thousand strangers.
- Re-run the numbers every cycle. Volumes shift fast. Two minutes with the calculator keeps the real cost visible when budgets are set.
83 hrs to read 1,000 applications at five minutes each — the pile from just ten typical roles
11 days the same figure as full working days of salaried screening time, every year
2 min to run your own numbers and put an annual figure on it
EXPERT INSIGHT
Ben Schwencke, Chief Psychologist
Ben leads Test Partnership's research and development, including the psychometric validation of MindmetriQ™. He holds an MSc in Organisational Psychology (Birkbeck, University of London), is a BPS Registered Test User in ability and personality testing, and has spent more than 10 years designing psychometric assessments, specialising in computer-adaptive testing and item response theory. This calculator's assumptions — review time per application, the slice of a test-ranked pool worth reading, what test-first funnels cut — come from that work, and every assumption is shown alongside your result.
What you'll get
An annual figure you can take to leadership — not a vague sense of "a lot".
1
Your annual figure
The hours and pounds your team spends on manual screening each year, calculated from your own numbers.
2
Your category
One of four bands — from "Manageable — for now" to "A six-figure leak" — with an honest headline.
3
Test-first comparison
A side-by-side view of the same funnel when a short assessment ranks candidates before anyone reads a CV.
4
Every assumption, shown
The modelling behind your result is displayed with it — so the figure survives scrutiny when you share it.
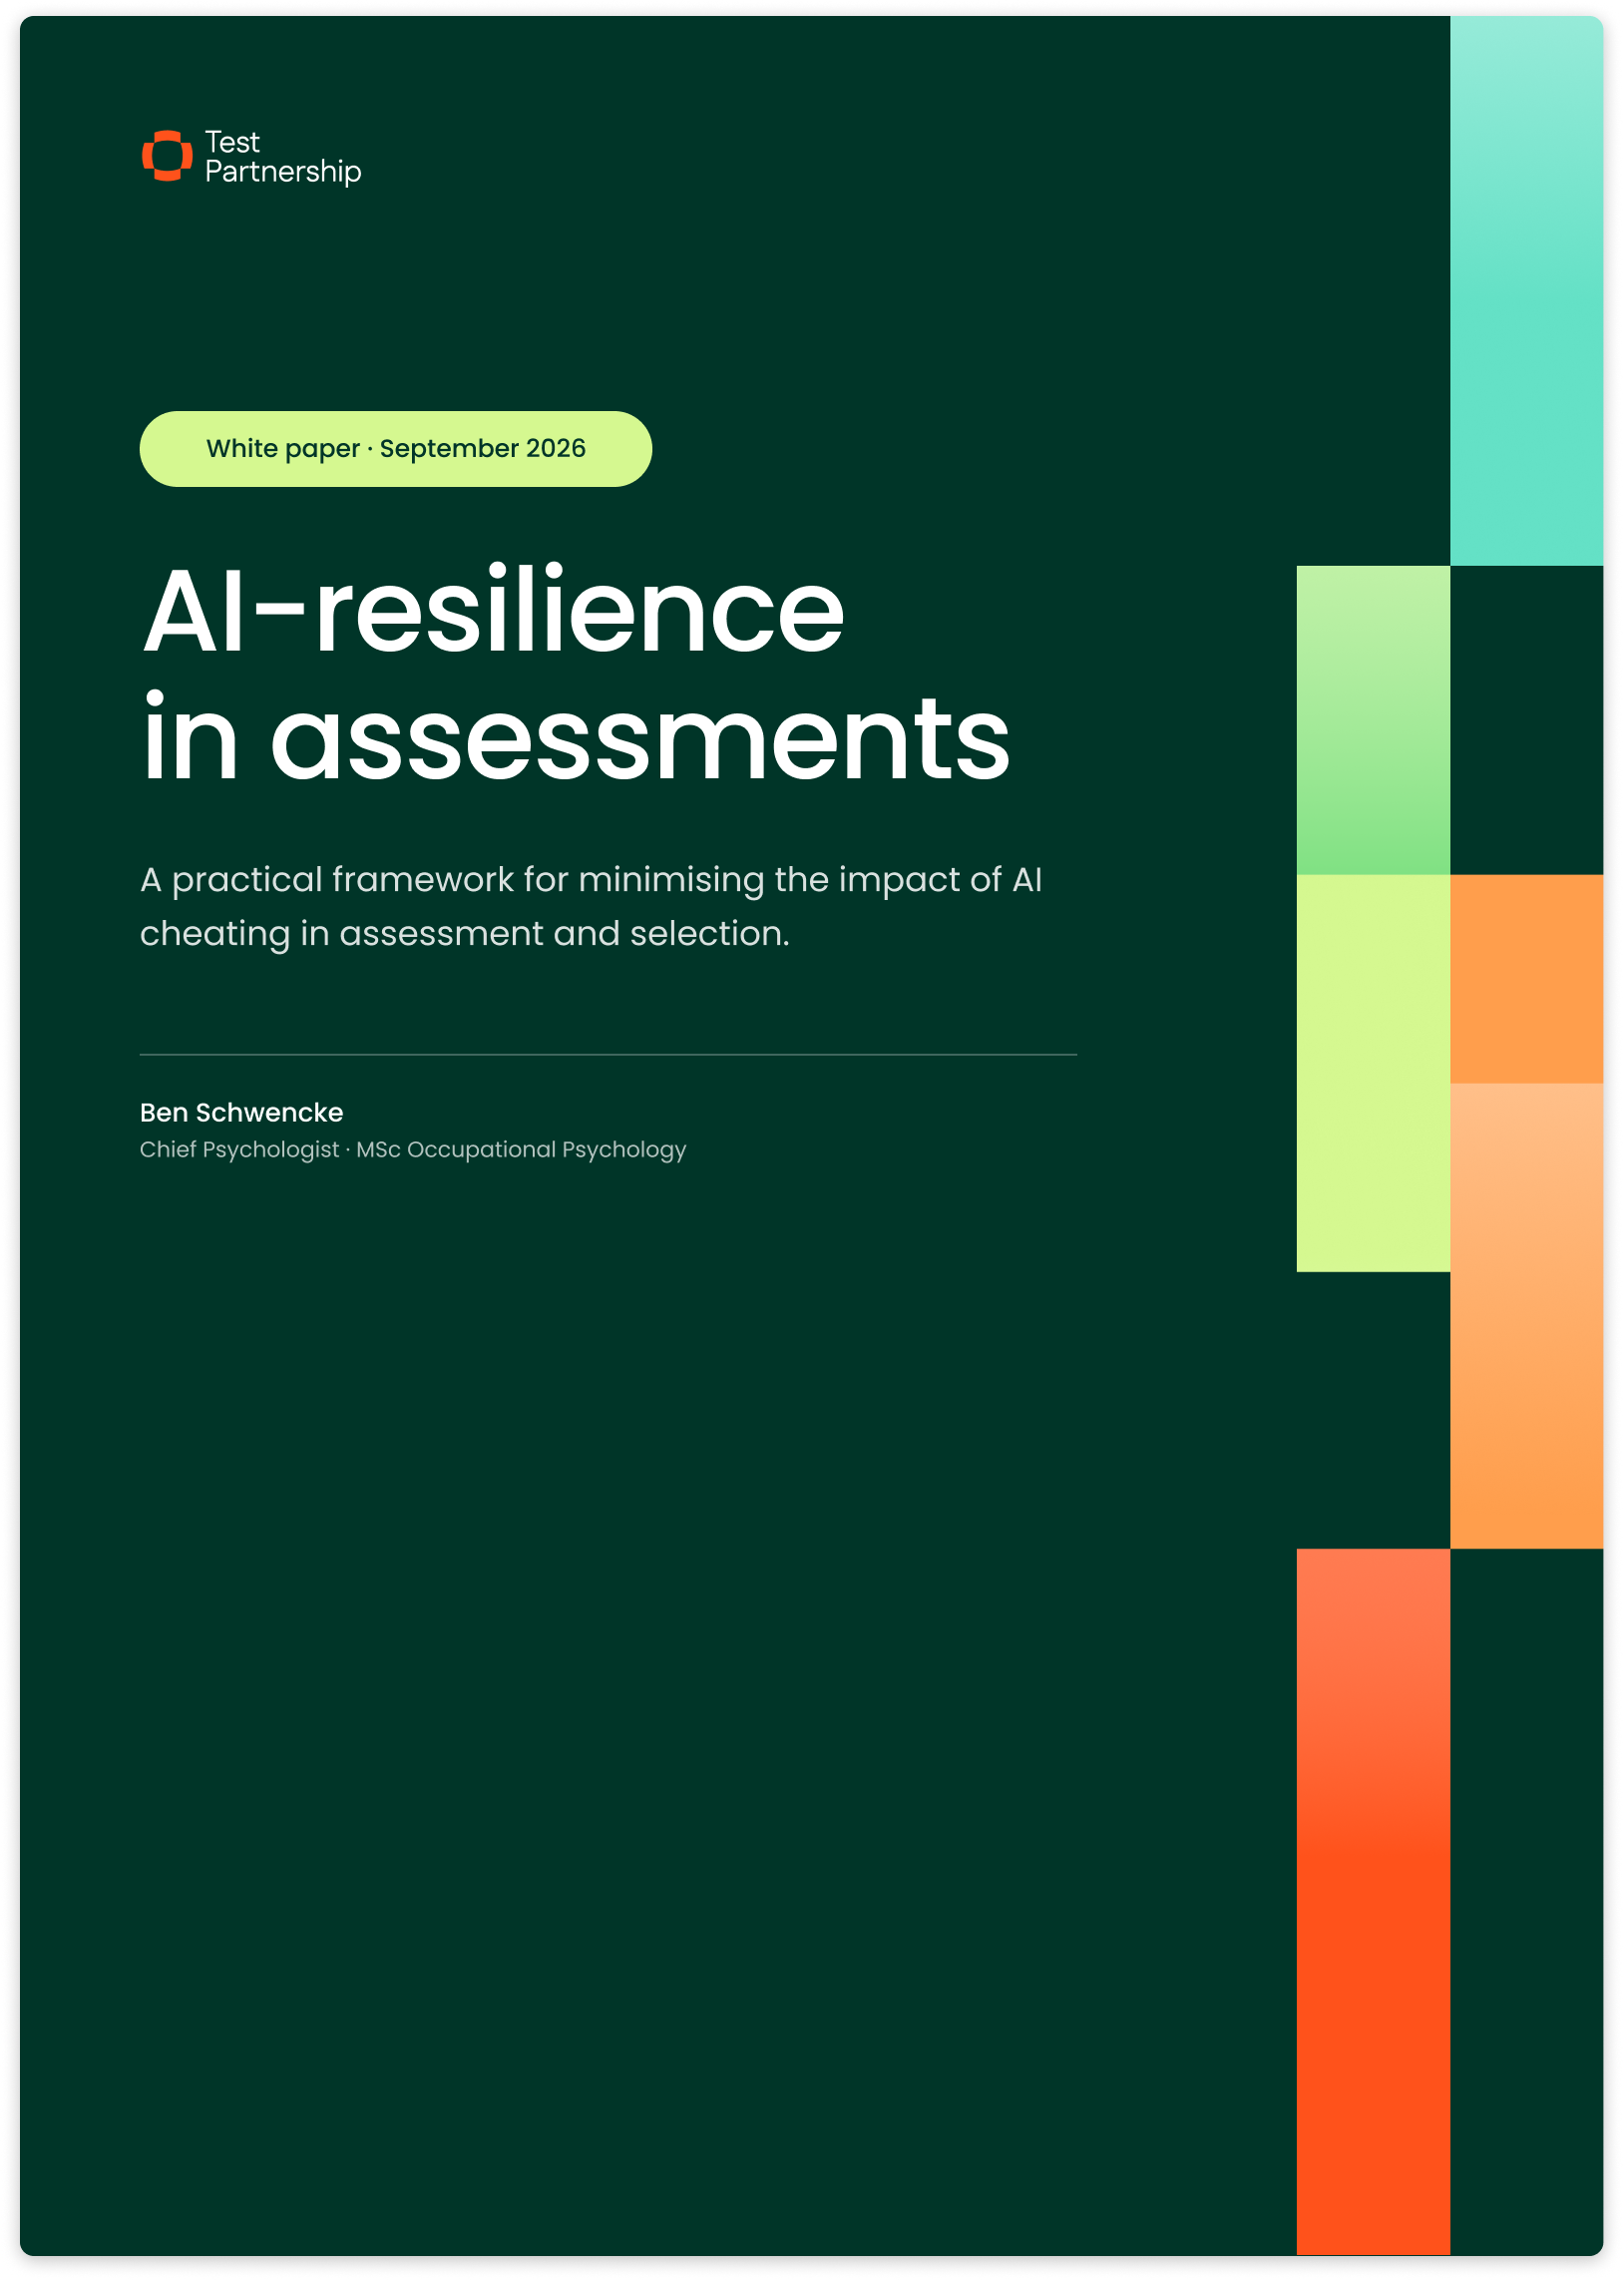
NEW RESEARCH · FREE WHITEPAPER
AI-resilience in assessments
Our Chief Psychologist's full framework for minimising AI cheating in assessment and selection. Fully referenced, honest about its limits, and free with no email required.
- Why a 5% cheating rate can mean half your shortlist
- 12 selection methods ranked from safest to most AI-vulnerable
- The nine-principle ACT framework, with surveillance deliberately last
What clients say
Hiring teams put the hours back into better decisions.
Test Partnership clients use test-first screening to spend less time reading applications and more time with the candidates who matter — with support from our psychologists at every step.
Test Partnership are a breath of fresh air... every call I have with them is quick, helpful and full of insight.
Stephen Reilly Global Talent Acquisition Specialist

The psychometric tests have significantly improved our hiring process, leading to numerous acknowledgments and referrals from our clients who appreciate the thoroughness and accuracy these tools bring to recruitment.
Annet Wambui HR Business Partner, AMSOL

Ben has always been extremely helpful when we have any questions and the tests themselves are so valuable to really understand our people.
Anna O'Mahony Operational Support Lead, Vitality

I appreciate that support is immediately available to help me choose the right tests for the role I am recruiting for. For an SME like us, Test Partnership makes hiring easier and cost effective.
Marina Prifti HR Manager, Ampersand

Common questions
Everything you might want to know before you run the numbers.
Your annual application volume (roles × applications per role) is multiplied by your review time per application to give screening hours, then by your hourly reviewer cost to give the annual figure. First-stage interview time is modelled from your interview rate and interview length. The test-first comparison assumes you review only the top 30% of a test-ranked pool (a 70% reduction in manual reading) and avoid 40% of first-stage interviews that would otherwise go to candidates a valid ability test would have filtered out. All assumptions are shown with your result.
They're deliberately conservative. The calculator excludes several real costs entirely: the downstream cost of mis-hires from inconsistent shortlisting, offer-stage re-runs when a shortlist collapses, and the opportunity cost of hiring managers' time. Treat your result as a floor, not a ceiling.
A reasonable rule of thumb is annual salary plus on-costs (typically salary × 1.25–1.3), divided by annual working hours (around 1,700). The default of £25/hour roughly reflects a mid-level UK people-team salary with on-costs. If hiring managers do much of your screening, their rate is usually higher — adjust accordingly.
No cost, and no email required. Your full result and the assumptions behind it appear directly on the page. If you'd like to talk through what test-first screening would look like for your funnel, you can book a call from your result — but that's entirely optional.
Yes — the result is visible on screen and can be screenshotted or shared. Many teams use it as the opening slide in budget and process-review conversations: an annual figure, from your own numbers, with the assumptions attached.